The Geometry of Learning: Mapping the Evolution of Mastery through KSTs
Beyond Binary Outcomes to Visualize the Human Learning Process
In the traditional educational paradigm, we are often obsessed with the "endpoint." We measure learning outcomes through binary filters: pass or fail, certified or uncertified, graduated or dropped out. However, for those of us operating at the intersection of technology and pedagogy, these metrics are increasingly insufficient. They tell us where a student ended up, but they reveal nothing about the topography of the journey itself.
Years ago, I initiated a project at Platzi Master aimed at solving a fundamental tension in high-performance education: how do we track the real-time evolution of mastery in a highly personalized, coaching-based environment without resorting to the reductionist nature of standardized testing? The answer lay in the development of Knowledge, Skills, and Technologies (KST) Mastery Maps.
1. The Philosophical Friction: Personalization vs. Standardization
The core value proposition of Platzi Master was its coaching-based, highly personalized approach to learning. In such an environment, creating a standardized learning path or a fixed curriculum is counter-productive; it ignores the unique professional goals and existing mental models of the student. Creating a standardized learning path that every student must follow actually counters the goals of such a program.
However, we faced a persistent challenge. The tech job market does not hire based on intuition: it hires based on specific, demonstrable competencies. While standardized curriculums are not desired, the market needs competent developers in specific competencies that can be listed. To bridge this gap, we needed a solution that could offer coaches, students, and program managers a way to visualize competency acquisition without enforcing a set curriculum. We needed to see the "Knowledge Space" as it was being built.
2. The Framework: Knowledge, Skills, and Technologies
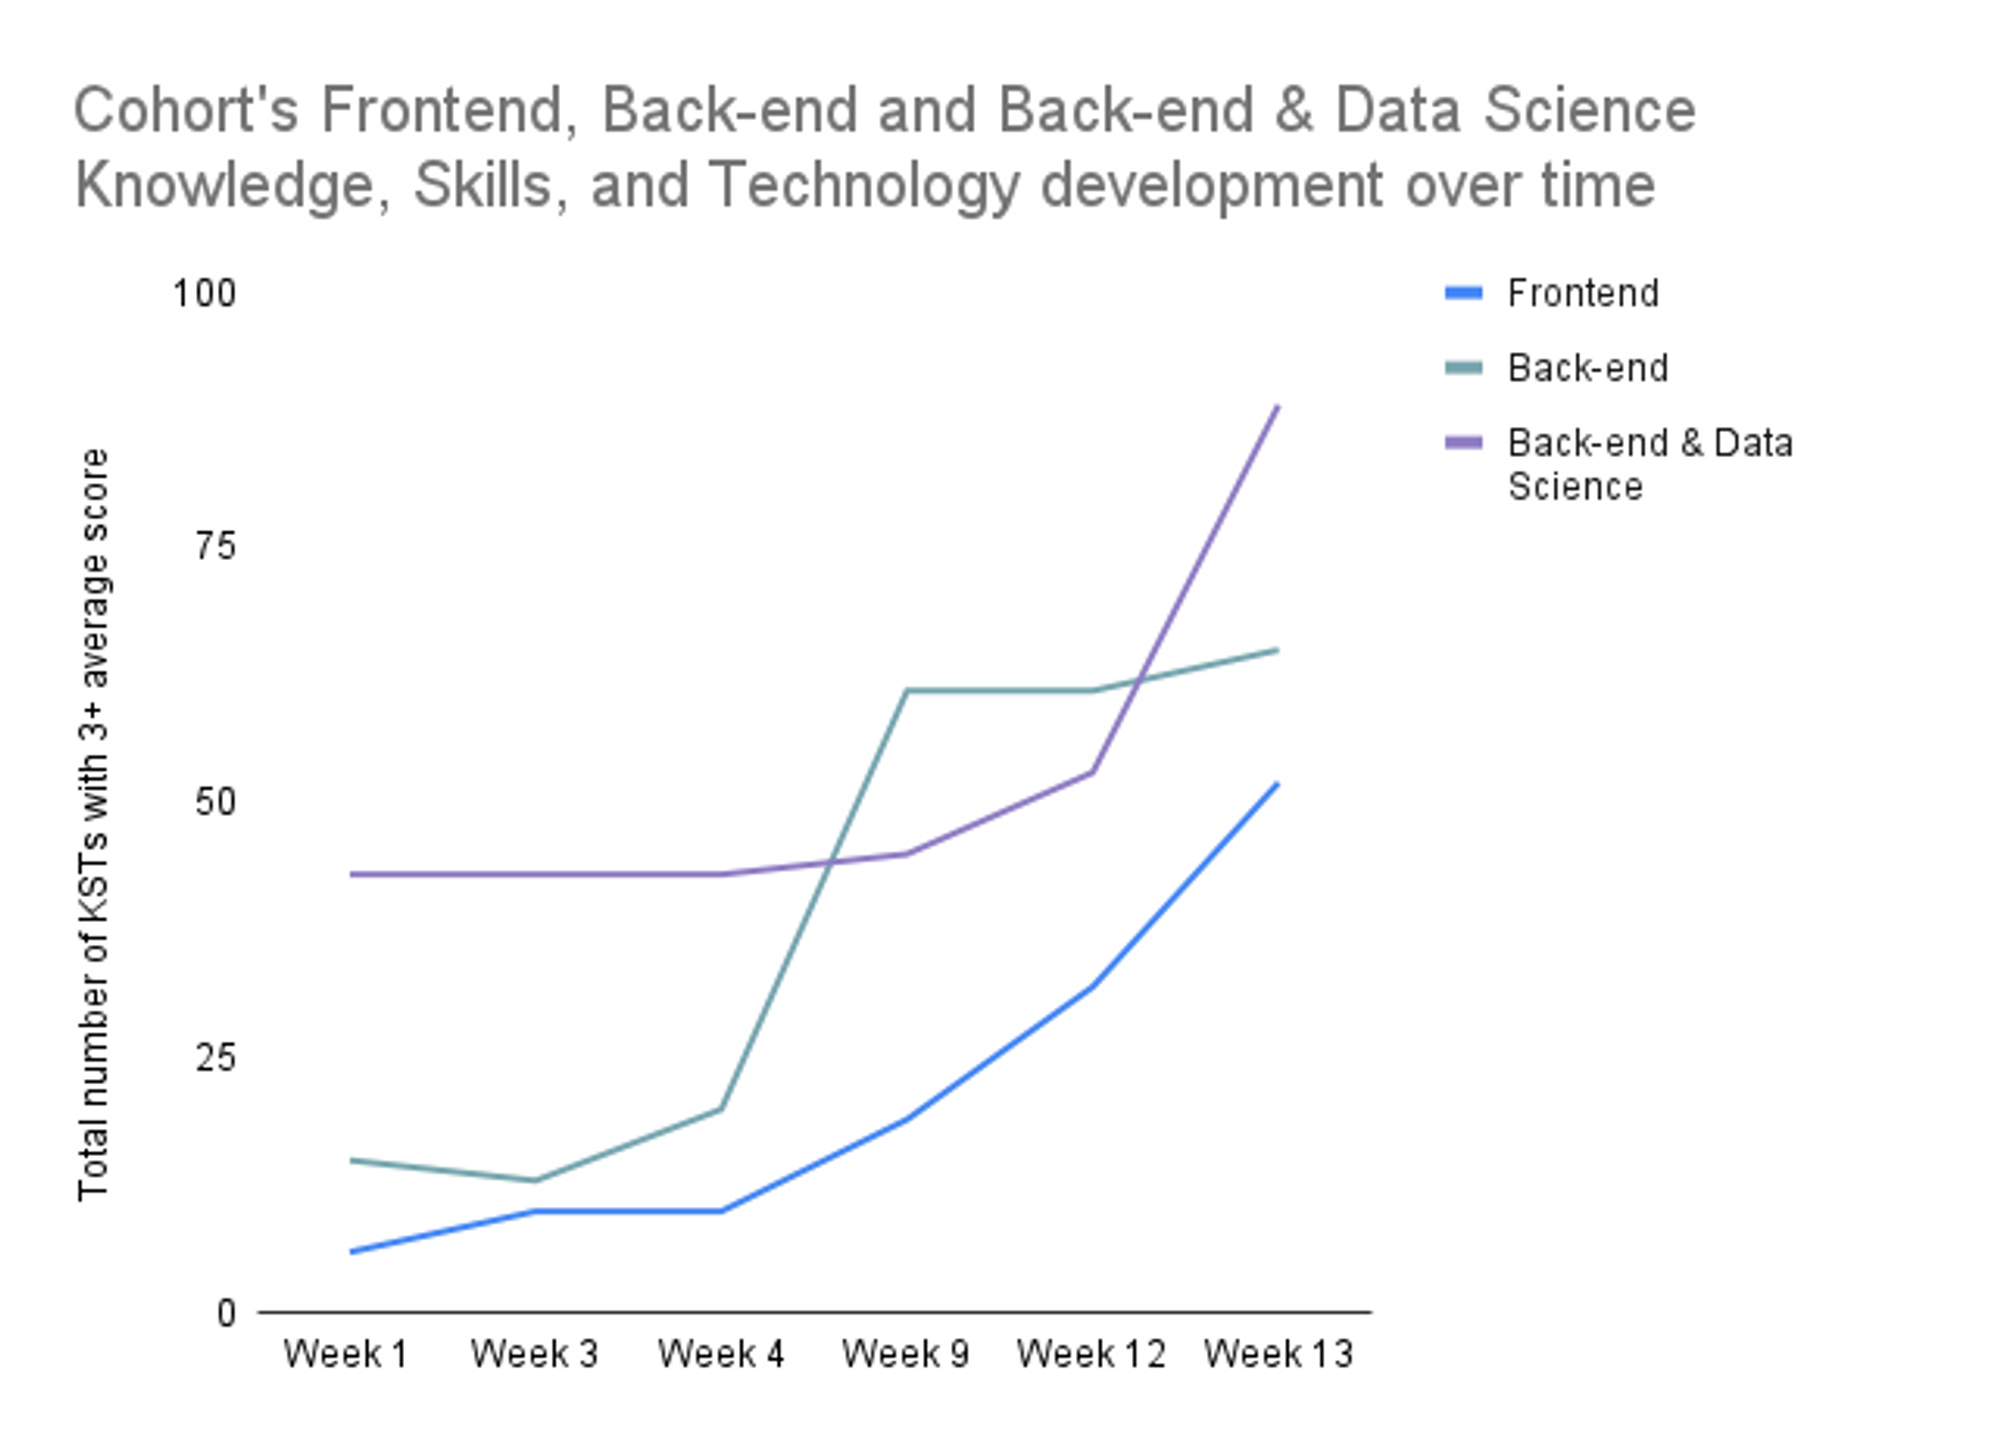
We began by collaborating with domain experts, including Data Scientists and Technical Coaches, to build exhaustive catalogues for our primary focus areas: Frontend, Backend, and Backend & Data Science. We organized these catalogues into Milestones, which we defined as the sets of KSTs that signal a key component of professional development. Ideally, a student should have the freedom to master any milestone that contributes to their professional goals.
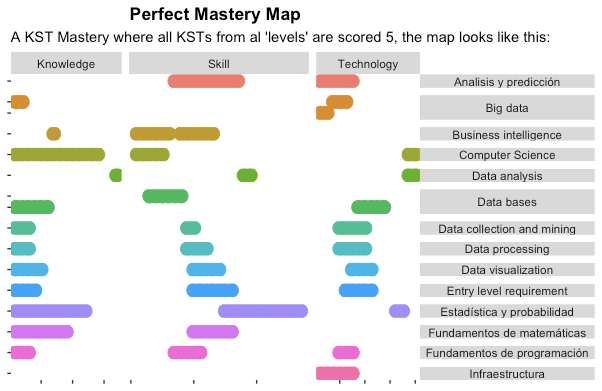
To measure progress, we implemented a granular 0 to 5 scale that moved away from traditional grading and toward a mastery-based rubric:
- Level 2: Insufficient level. The student has little experience and is not yet capable of resolving related problems due to lack of practice or training.
- Level 3: Skilled level. The student has solved related problems and can resolve future ones if they have sufficient guidance and support.
- Level 4: Solid level. The student has solved problems in the past and can face related problems with little to no support.
- Level 5: Mastery level. The student can not only solve the problem but can also teach others how to develop that competency.
3. Visualizing Progress: Scatter Plots as Cognitive Fingerprints
The technical innovation of this project was the use of jittered scatter plots to represent a student's current knowledge state. By assigning unique X and Y coordinates to every KST item in the catalogue, we could plot a student's mastery in a way that revealed a unique "pattern" or "fingerprint" of their expertise.
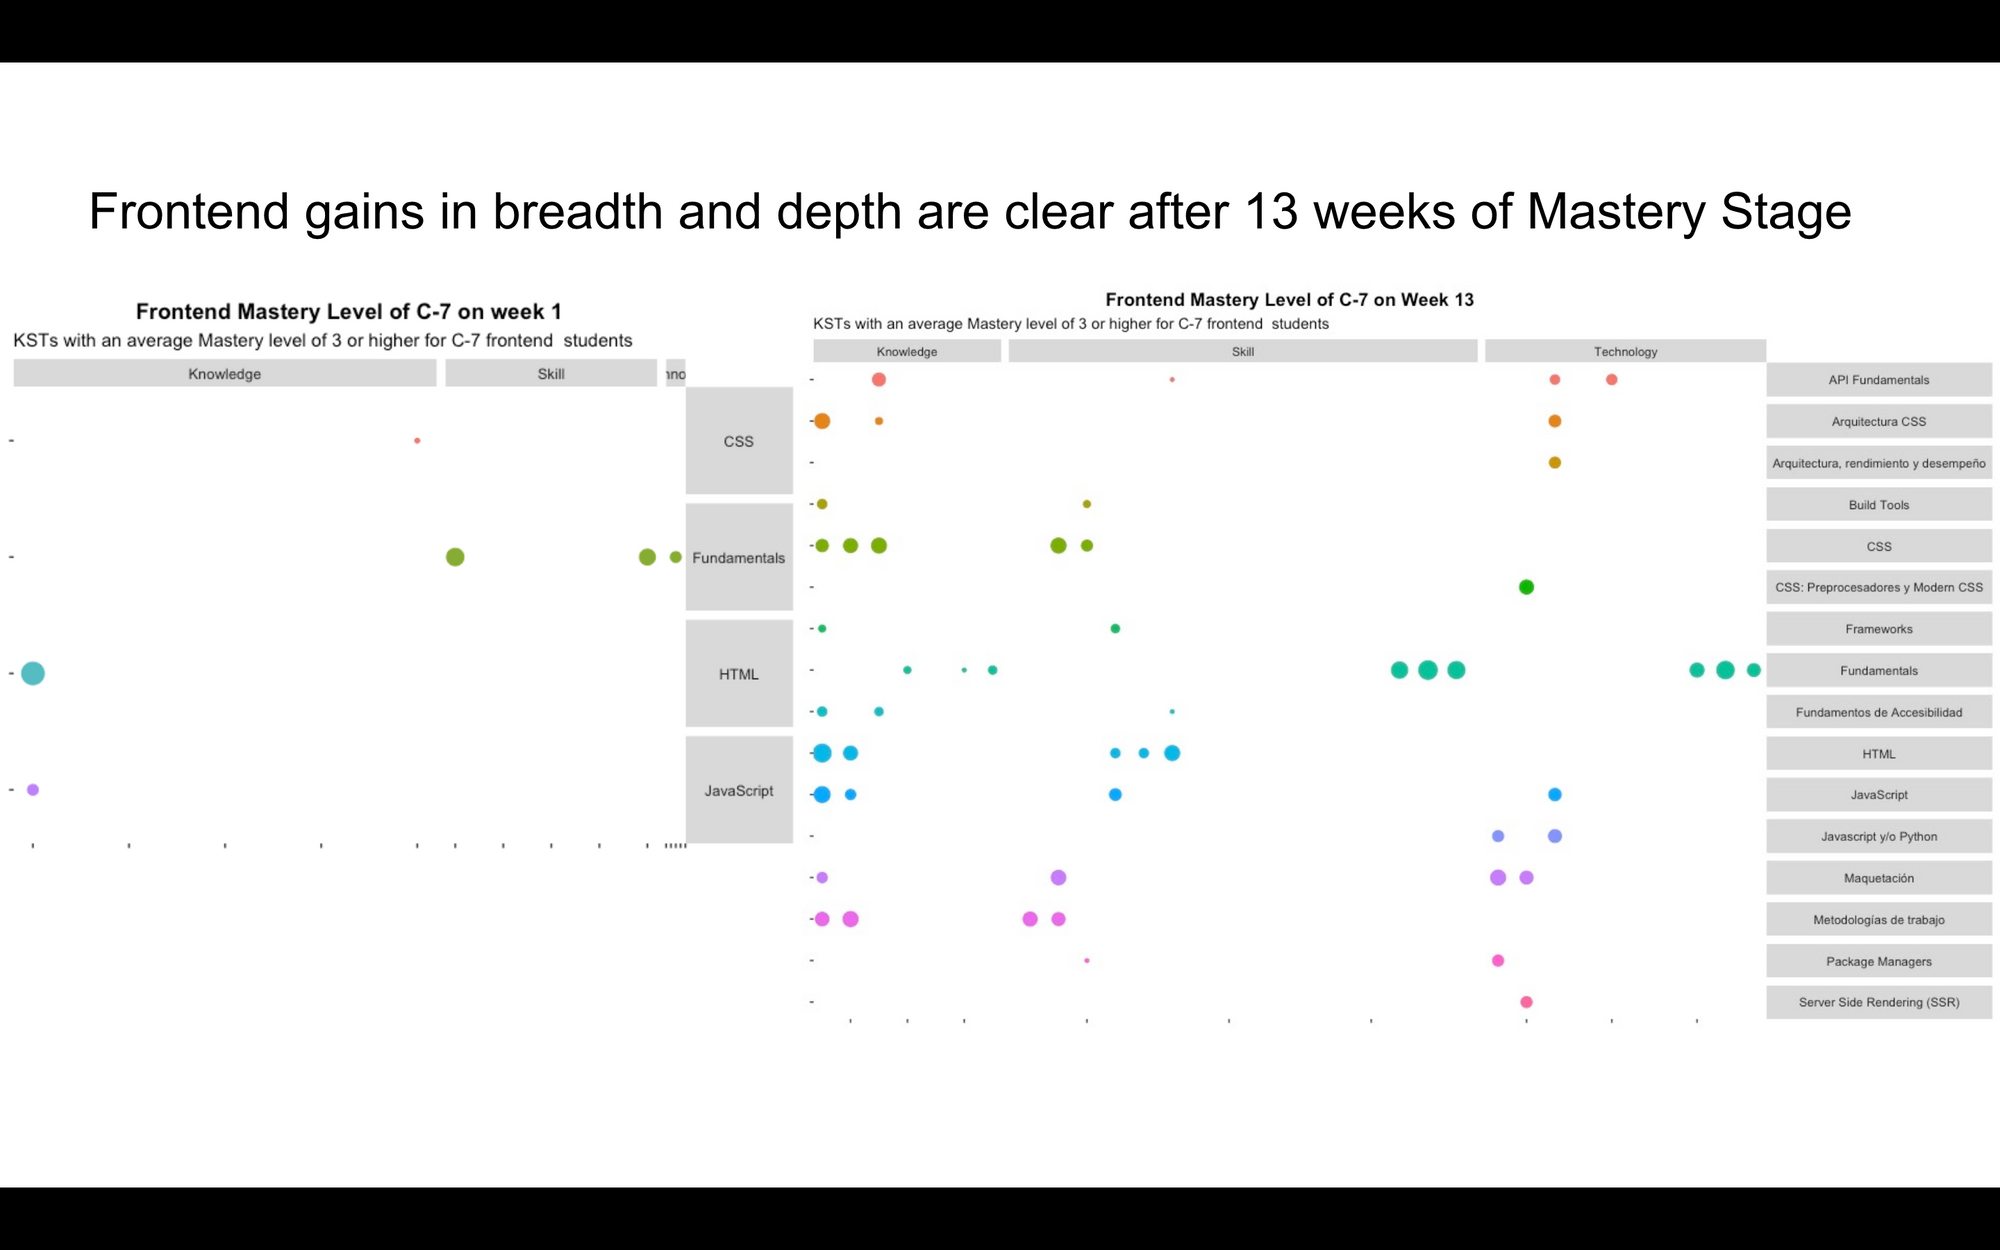
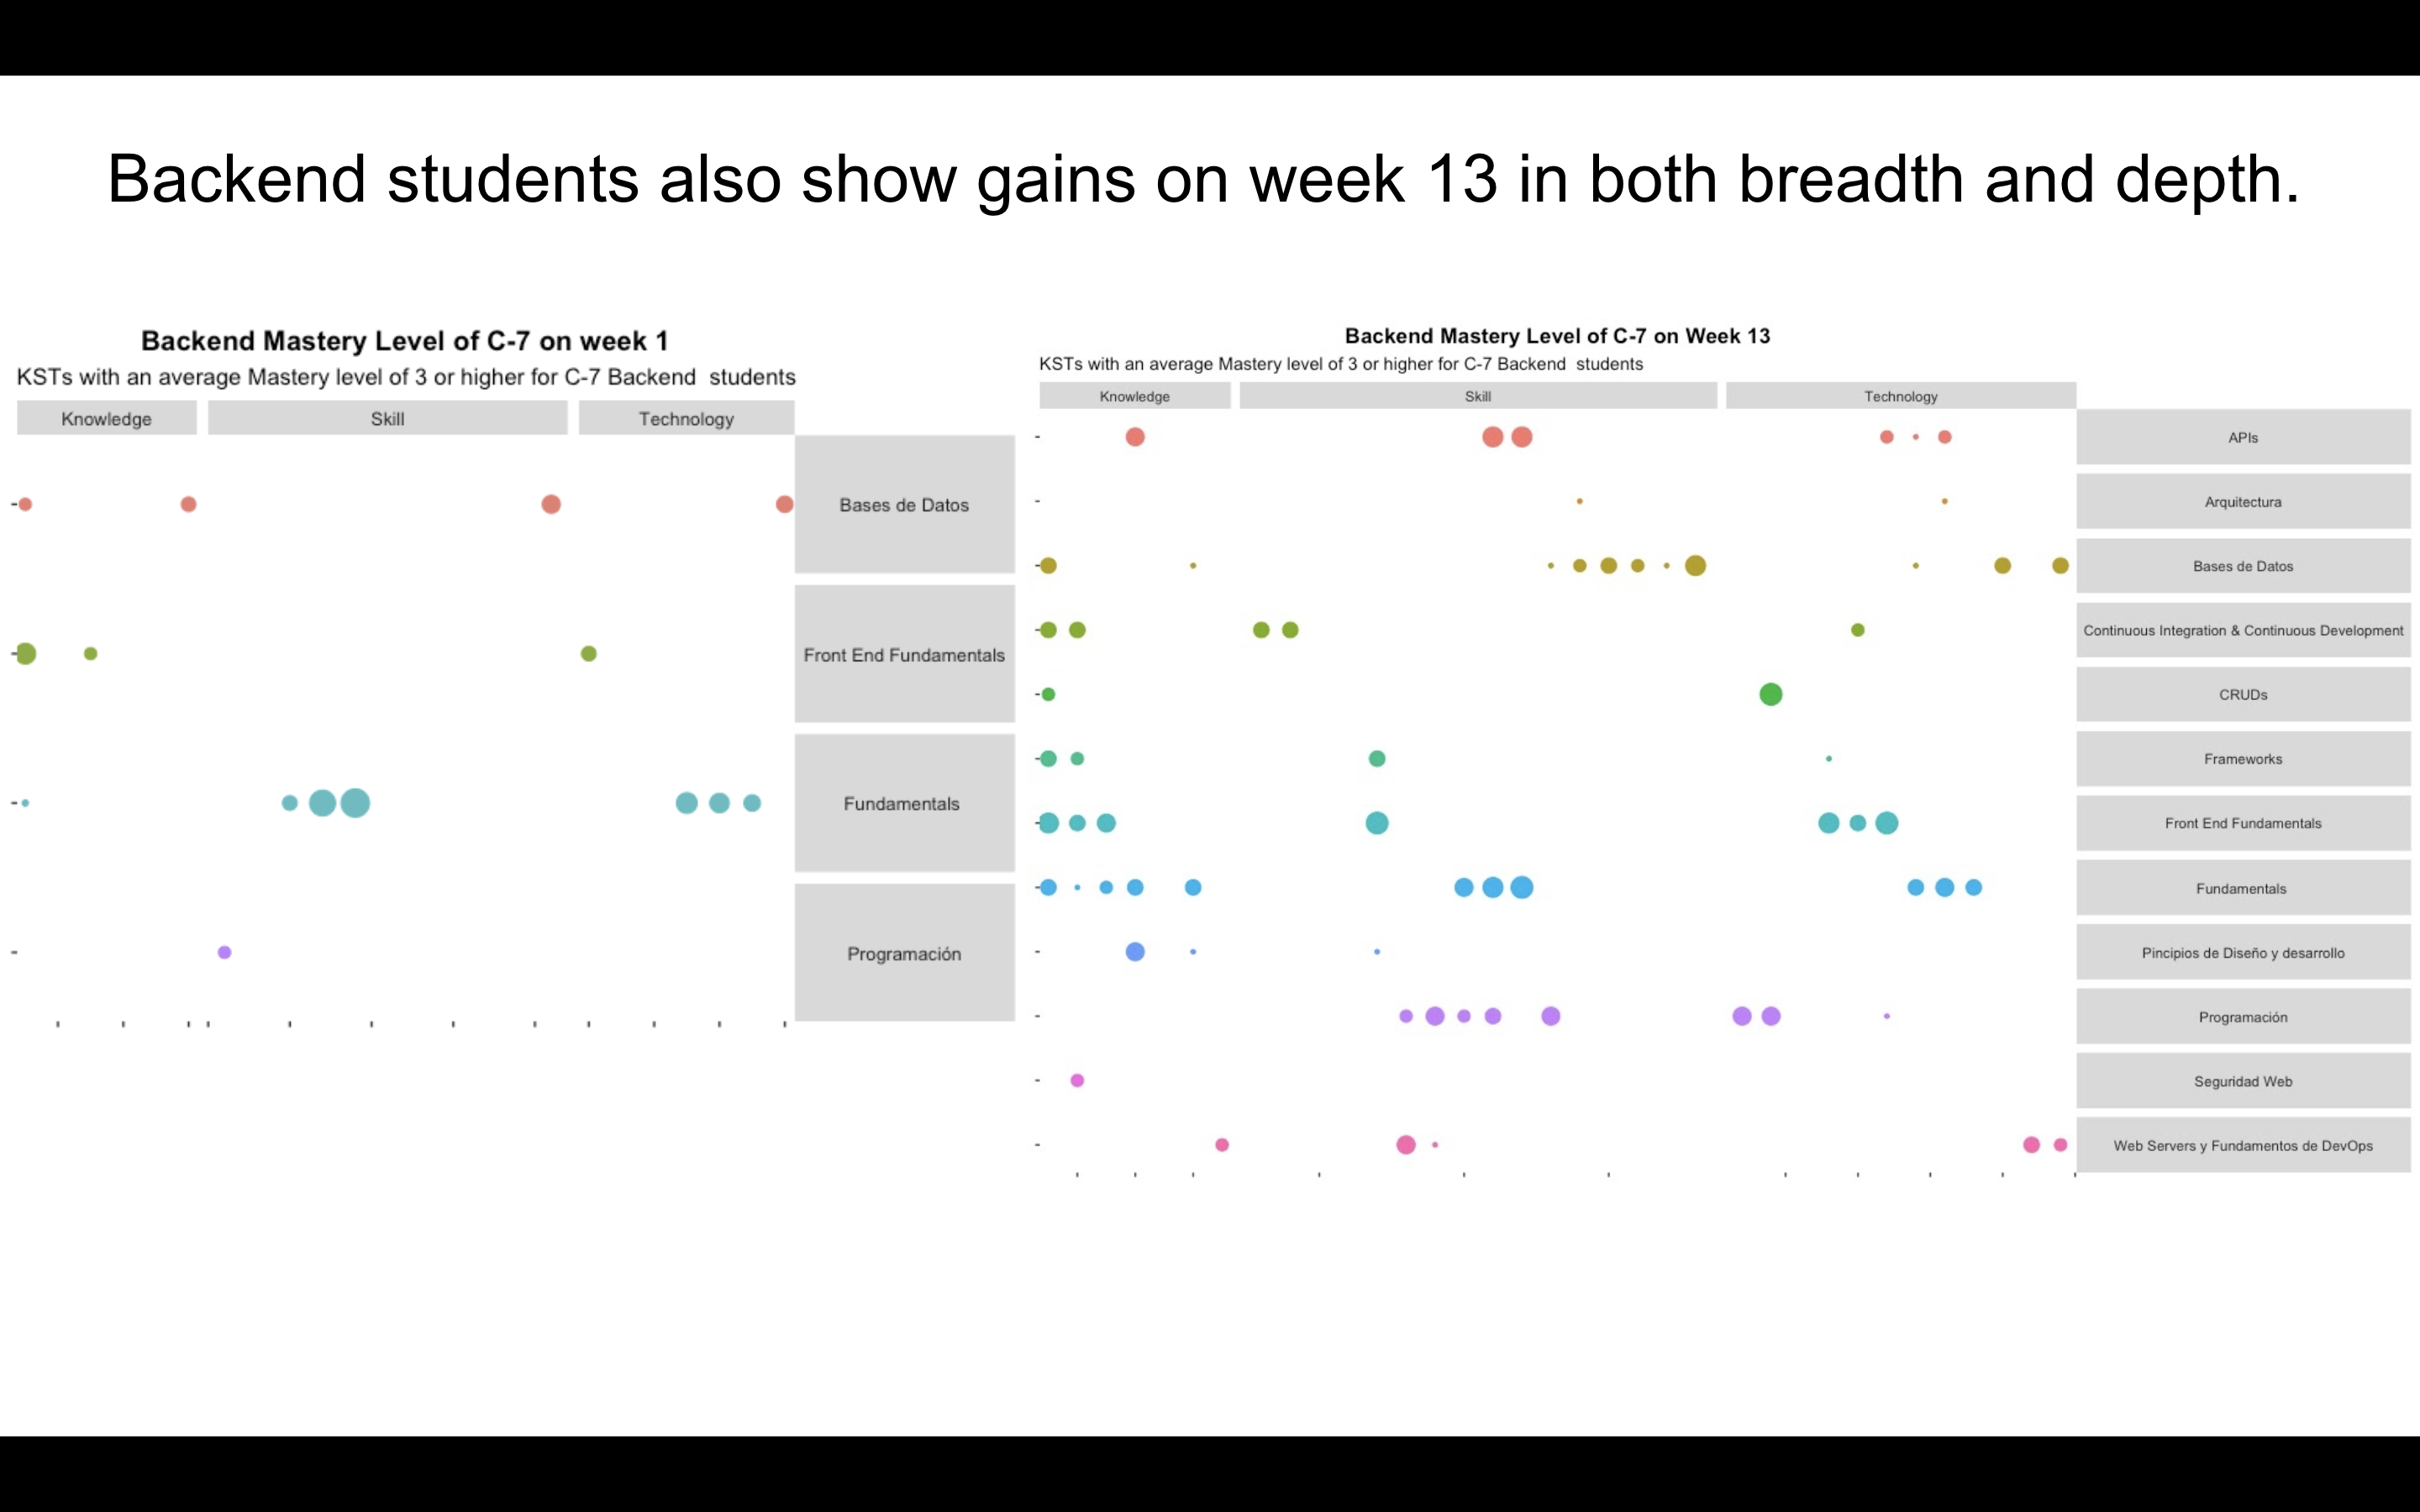
Using R and Plotly, we generated interactive visualizations that allowed us to filter for KSTs where the student had reached Level 3 or higher. This moved the conversation from "What grade did they get?" to "What does their current skill map look like?". Monitoring these weekly allowed us to assess program efficacy and deliver actionable feedback to students. Monitoring each student weekly can reveal the KSTs developed over time, enabling a bird's-eye view diagnosis of where students currently are.
4. Reflections from the Field: The C-7 Pilot Insights
When we piloted this on the 7th student cohort (C-7) during the Mastery Stage, the data revealed trends that often go unnoticed in traditional grading systems.
The Dunning-Kruger "Reality Check"
In the Backend & Data Science cohort, we observed a distinct "drop" in KST scores between Week 1 and Week 2. This was not a failure of learning, but a triumph of accuracy. In Week 1, students self-assessed their levels; by Week 2, after facing their first real project, their coaches provided a more rigorous assessment. This effectively captured the transition from unconscious incompetence to conscious incompetence, grounding student expectations in reality.
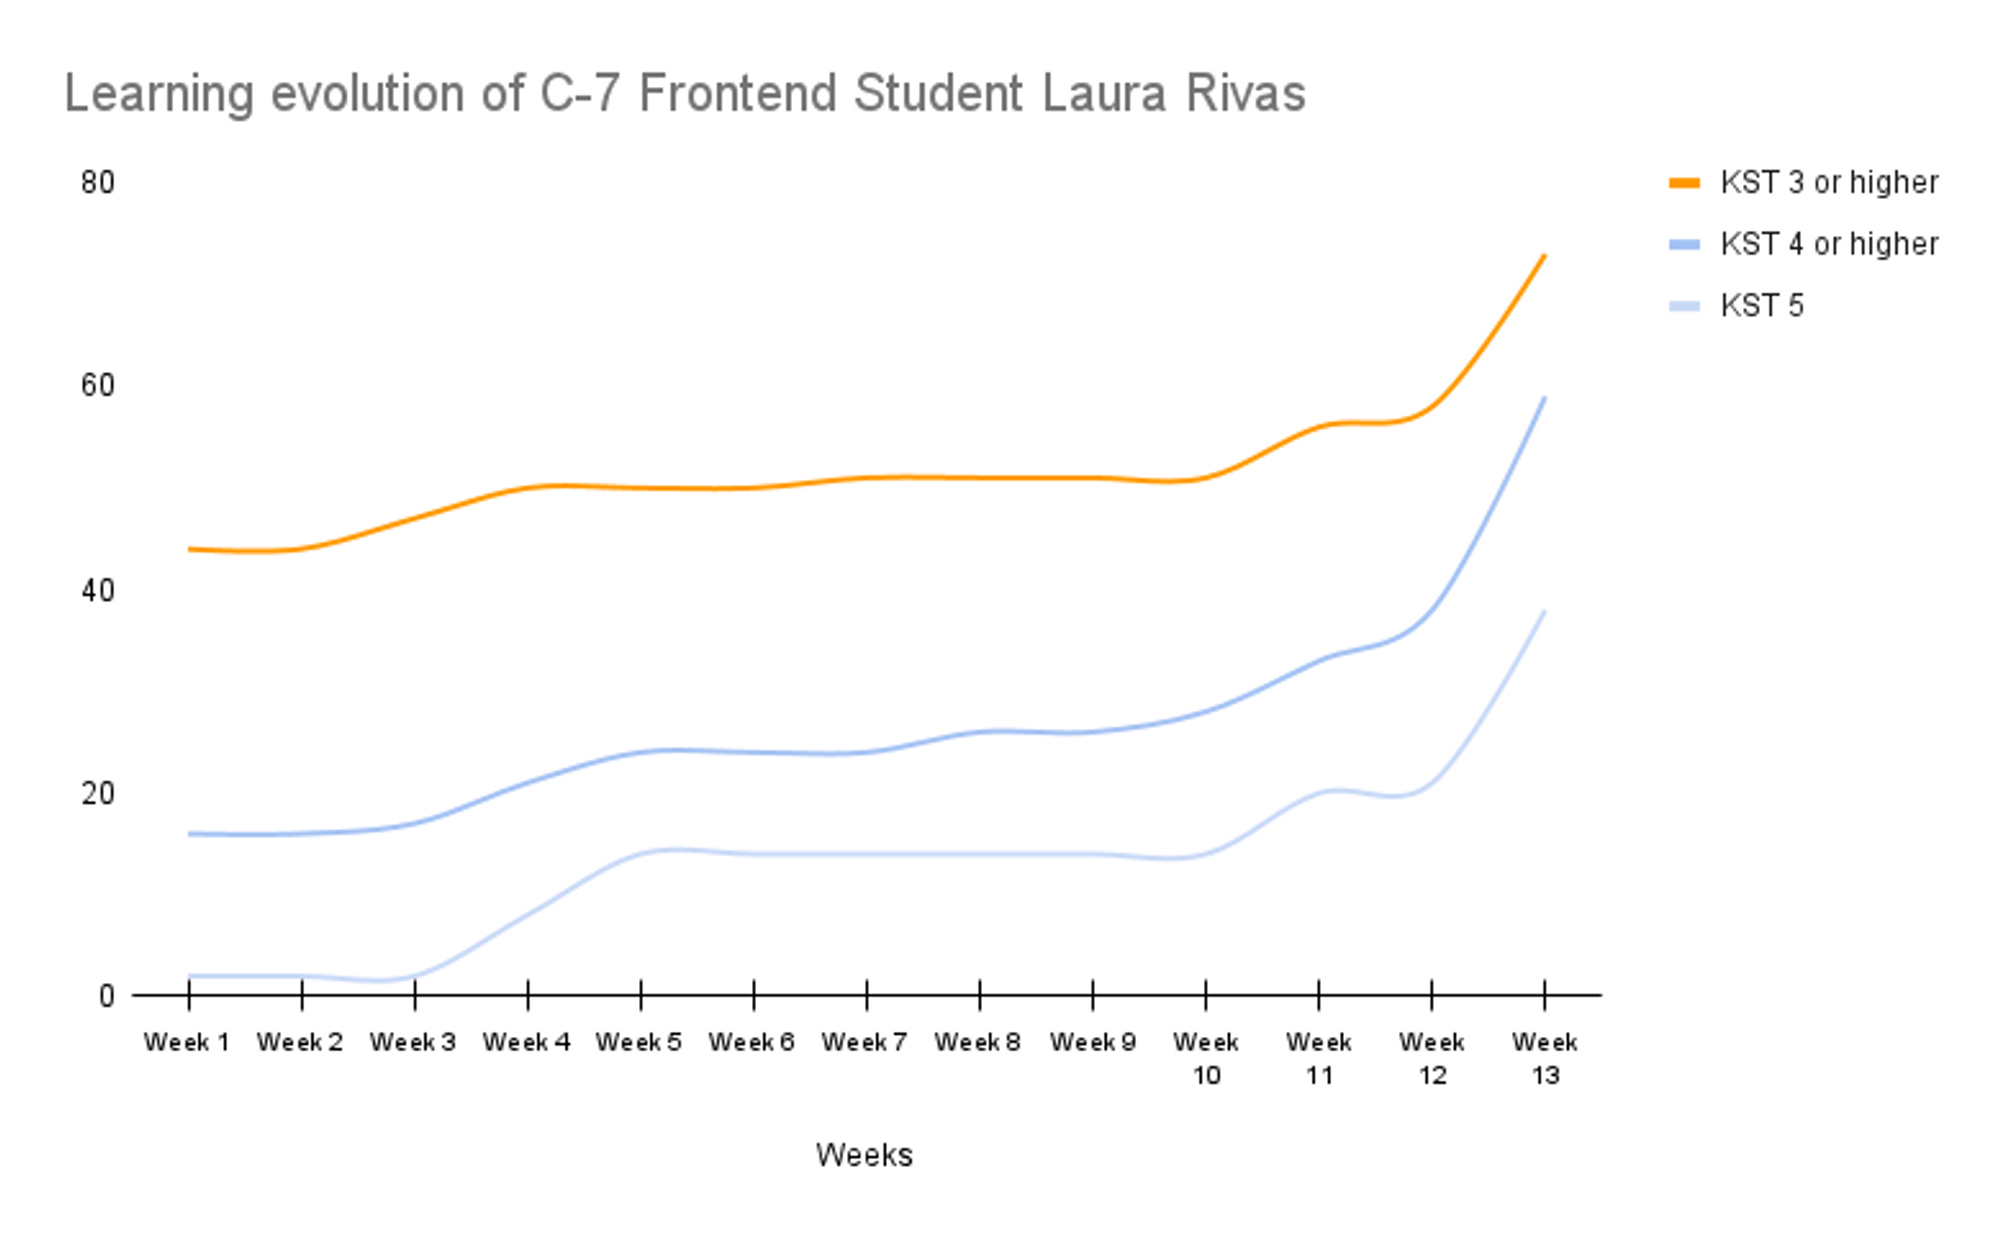
Depth vs. Breadth: The "Laura Rivas" Insight
Longitudinal tracking of students, such as Laura Rivas, showed that progress is rarely linear. Between Weeks 3 and 5, Laura's map showed very little increase in "new" competencies (KST 3+). In a traditional system, this might look like a plateau. However, our maps showed that she was progressing significantly in depth, moving existing skills from Level 4 to Level 5. This meant she did not acquire new competencies in those weeks but gained a deeper level of understanding in the first weeks of the cohort. She wasn't just learning more things: she was learning things better, proving that deepening mastery is as significant as acquiring new skills.
Operational Efficiency: From Days to Minutes
The impact on staff was profound. Master Coach Ana Belisa noted that while organizing a new cohort previously took her a full day of manual auditing, the Mastery Maps allowed her to diagnose the entire cohort, detect needs, and assign projects in under an hour. She reported being able to saqué nivel, habilidades, and acomodé equipos de estudiantes in much less time than before. Educators often spend too much time on diagnosis; these maps flipped the ratio, allowing for more time spent on active coaching.
5. The Evolutionary Leap: From Points to Graphs
Looking back, while 2D scatter plots successfully created a "fingerprint" of knowledge, they treated KSTs as isolated points. The next logical step is moving toward Knowledge Graphs. Instead of seeing mastery as a collection of dots, we should visualize the prerequisite links between them. If a student is stuck on a high-level technology, the graph could highlight that they have a hidden Level 2 gap in a foundational milestone, making the non-linear path to mastery clear and actionable.
6. Challenges and the Path to the Meta-Catalogue
Despite the success of the pilot, we identified significant hurdles. The process was manual and tedious, involving "unproductive labor" to process R scripts and fill catalogues. Several days of unproductive labor were invested in creating each mastery map and organizing reports. Scaling this requires:
- Automated Rendering: Completion of courses or projects should automatically update a student's map.
- Flexible Specialization: A "Universal Competency Catalogue" would allow students to include skills from mixed areas (for example, Frontend and Data Science) according to their own goals.
- B2B Integration: Organizations could understand the total "pool of KSTs" in their teams to strategically address skill gaps and map organizational evolution.
This project was never just about tracking skills: it was about proving that we can make the invisible process of learning visible. By visualizing the "Geometry of Learning," we move closer to an educational model that respects the complexity and unique potential of every student.
Suggested Reading
- Towards a Reskilling Revolution, World Economic Forum.
- Jobs of Tomorrow: Mapping Opportunity in the New Economy, World Economic Forum.